This section of this blog is devoted to concise explanations of six central scientific points associated with global warming. If you know and understand these 6 points, you will be scientifically up to speed on the issue.
Point 1. The total heat content of the Earth simply has to be (and is) increasing.
The figure below shows the Earth being irradiated by sunlight (Ultra Violet and Visible Radiation) coming in from the right side (solid blue lines). Some of this solar light is reflected back out into the universe and therefore does not heat the Earth. This portion of reflected sunlight is called the albedo (shown as the dashed blue lines) and for the present conditions on Earth the albedo is about 30%. Thus the Earth is heated by the remaining 70% of incoming solar radiation that “sticks” to the Earth and is not reflected.

The Earth must also have a way of cooling itself – otherwise it would continuously get hotter and not achieve a final stable temperature. The Earth does this by the emission of infrared (IR) radiation in all directions, just as a hot stove does. This IR radiation is shown by the red lines in the figure. So as the Earth is warmed due to its absorption of incoming sunlight, a point is reached where the energy emitted via outgoing IR radiation becomes equal to that of the incoming sunlight and the Earth has then reached a stable condition in which the average global temperature will remain constant.
Next, note that I have drawn in the figure a thick black circle around the Earth which I am using here to represent the Earth’s atmosphere. Turns out that our atmosphere contains minor components (we call them the greenhouse gases) that absorb IR radiation, thereby preventing most of the IR radiation emitted by the Earth from escaping our planet. Therefore, the surface and atmosphere of the Earth gets warmer until they manage to punch out the required amount of IR radiation required for reaching a steady state. The surfaces of the Earth are thereby made about 59 degrees F warmer than they would be in the absence of those greenhouse gases. This is a good thing. The natural Earth would be far too cold for existing forms of life if we had no greenhouse gases.
OK, so why is the total heat content of the Earth increasing? The answer to that question is that one of the factors described above is totally out of control today. That factor is the insulating power of the greenhouse gases in our atmosphere. That insulating power is increasing and just as you get warming if you put on a heavier coat, the Earth is getting warmer as its insulating coat gets heavier.
Point 2. Why the insulating effect of our atmosphere is increasing?
Of the permanent (that is, of compounds that live long enough in our atmosphere as to become well-mixed throughout it) greenhouse gases in our atmosphere, carbon dioxide (CO2) is the most abundant. In addition, once added to the atmosphere via fossil fuel combustion, that extra bit of CO2 stays there for a much longer time (several centuries, in fact!) than do the other greenhouse gases (the reason for this long lifetime will be explained in the next section). Since the beginning of the Industrial Age, man-kind has been putting vast amounts of CO2 in the atmosphere by the combustion of fossil fuels. The effect of this is shown in the figure below.

Background CO2 measurements such as these are now made at many remote sites throughout the world and all show essentially the same result. The CO2 level is now passing the 400 ppm mark and is continuing to increase at a rate between 2 and 3 ppm per year. Via the ice core record (see my blog post in June 2015 if you don’t know what the ice core record is), we also know that the background CO2 level of the atmosphere was about 280 ppm at the beginning of the industrial age in 1850 and never exceeded 290 ppm over the previous 800,000 years. Thus, the modern measurements shown in the figure above indicate a profound change in our atmosphere with respect to its most important greenhouse gas. There is now 40% more CO2 in our atmosphere than there has ever been in the last million years.
It is also worth noting that the “Keeling Curve”, as the plot shown in this figure is called in honor of the man who initiated it back in 1958, is the only measure that really matters in considering “how we are doing” in the battle against global warming. “Talk” concerning the development of alternate methods of energy. for example, mean little if the Keeling Curve continues to climb. Based on this all-important measure, therefore, it is clear that we are doing very poorly and things are still continuously getting worse. Any impressions to the contrary are just “talk”.
Point 3. Why the extra CO2 we add to the atmosphere lasts essentially forever
The Earth can be viewed to contain two very different forms of carbon, as shown in the figure below.
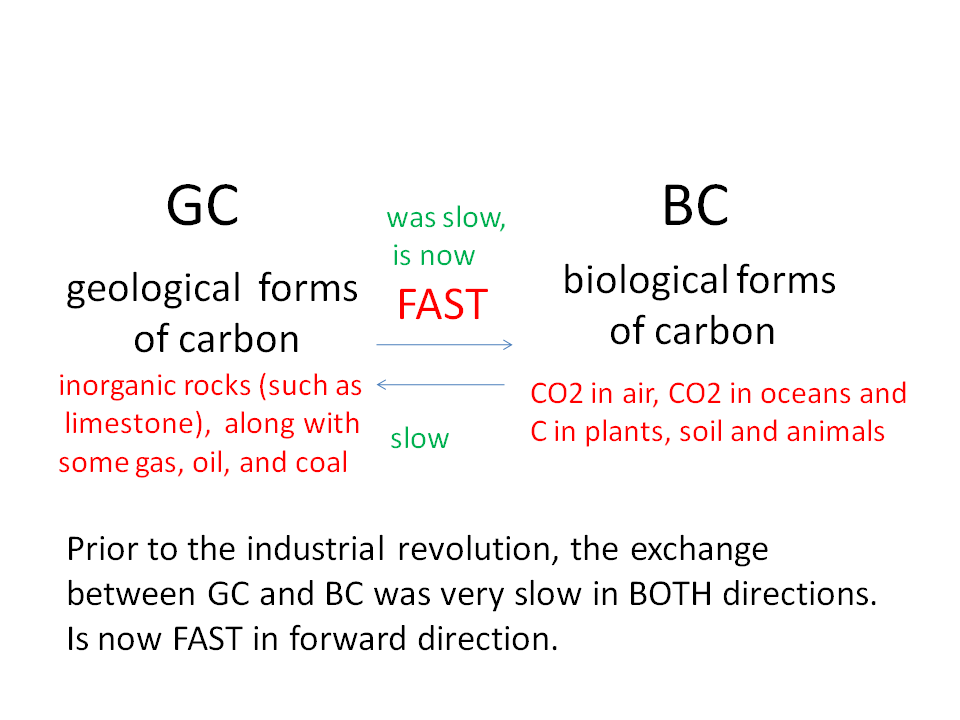
We will call one of these “geological carbon” (GC). GC includes the carbon in “inert” substances such as the fossil fuels (coal, oil, and natural gas) and various inorganic substances such a calcium carbonate (limestone). These forms of carbon stay put in or on the Earth essentially forever if they are left undisturbed.
The other basic type of carbon we will call “biological carbon” (BC). BC consists of the carbon of all living plant and animal materials as well as the CO2 in our atmosphere and the CO2 that dissolves in our oceans, lakes and streams. The BC forms of carbon are “active” and continuously cycle through the atmosphere, oceans, plants and animals very rapidly.
In addition, GC does not naturally change to BC and BC does not naturally change to GC. Therefore, the natural world contains a specific amount of BC that has remained constant for millions of years – until mankind learned how to generate energy by the combustion of fossil fuels. The present global warming problem has been caused by the exceedingly rapid rate with which man has been converting GC to BC by the combustion of fossil fuels. The biological world now contains about 40% more carbon than it did just 160 years ago! While the plants might like the EXTRA CO2 man has been adding to the BC cycle, both the atmosphere and the oceans do not.
In the atmosphere, this EXTRA CO2 increases the heat-insulating greenhouse effect of the atmosphere that was discussed in Point 2. So yes, just as you get warmer when you put on a heavier coat, the Earth also gets warmer as extra CO2 is added to the atmosphere by the combustion of fossil fuels.
In the oceans, the extra dissolved CO2 is converted to carbonic acid (CO2 + H2O = H2CO3), which makes the oceans more acidic, thereby perturbing its ecosystems. All shelled creatures wll be increasingly stressed because their shells are more soluble in water of higher acidity.
Now consider the very slow rate with which this EXCESS CO2 will be removed from the BC cycle and returned to the inert forms of GC. First, it takes at least several million years to naturally convert plant material to the fossil fuels. Another means of BC to GC conversion is called the “weathering” of CO2 by which the CO2 dissolved in rain drops or in the oceans comes in contact with rocks that convert a small portion of CO2 into inorganic substances such as limestone (CaCO3). Unfortunately these processes are all very slow and have a significant effect only over time scales of several centuries or millennia.
Therefore, as we convert GC to BC by the combustion of fossil fuels, that change to our atmosphere is essentially permanent on a time scale of relevance to human beings (several centuries) and the concentration of CO2 in the Earth’s atmosphere continues to rise each day as we continue with “business as usual”.
Point 4. We are presently doing a “grand experiment” on the only planet we have
In the figure shown below, the Earth’s temperature and the CO2 content of its atmosphere for the last 66 million years are provided.

Note that, in general, the Earth has been cooling over this long period. During the first 30 million years shown, after the disappearance of the dinosaurs 66 million years ago, CO2 levels were very high, well above 1,000 ppm, and as a result, the world was very hot – the Earth had no ice anywhere on it and sea levels were about 200 feet higher than today. During the last 35 million years, the Earth has continued to cool and now has a great deal of ice on it – mainly due to continuously lower atmospheric CO2 levels. In the very lower right-side corner of this figure, the most recent 3 million years are represented during which the Earth oscillated between its glacial and interglacial conditions. During glacial periods, CO2 levels were about 180 ppm and during the warmer interglacial periods CO2 levels were about 290 ppm.
Now also note in the figure above that the CO2 level today is about 400 ppm (and is increasing at a rate of 2-3 ppm per year). Thus, our planet is presently far out of balance with respect to CO2 – temperature relationships of the past. The only reason that the Earth’s temperature has not yet risen to the elevated magnitudes the planet had 10 million years ago is due to its thermal inertia – it takes some time for the Earth’s temperature to catch up with its new, increased level of greenhouse gas heating. For an analogy, envision a household iron plugged into an extension cord and then set on your sidewalk when it is covered with snow. Slowing, but eventually the heat from that iron will remove the snow from that region of the sidewalk. To complete this analogy we would also be continuously turning up the heat level of the iron in order to mimic our increasing level of atmospheric CO2.
So how long will it take for conditions on Earth to change towards the warmer and high sea levels of the past? We don’t know for sure. We do know that conditions are changing rapidly in the warming direction and this direction is one that the Earth has not experienced for more than 3 million years. We are indeed doing “an experiment” on the only planet we have – all due to a method we unwisely continue to use for energy production.
Point 5. Why this is our most URGENT issue, demanding IMMEDIATE action
A much under appreciated point is when the “peak” of world-wide CO2 emissions will occur. We are nowhere near that peak yet – CO2 emissions are still increasing every year. However, with the help of the following figure, we can see why we must achieve this point of peak emissions as soon as possible so that we stand a change of continuously decreasing emissions thereafter by the required amounts.

The CO2 emissions of the world since the beginning of the Industrial Age to Today are shown on the left side of this figure. The total cumulative emissions over that period is represented by the area under this curve, shown by the red hash marks. We know that those previous carbon emissions were about 500 tons of carbon and that they will increase the average surface temperatures of the Earth by about 1.0 degrees Centigrade (1.8 degrees F). The political leaders of the world have set a goal of limiting total surface average temperature increase to 2.0 C (note also that many scientists believe that this allowance is too high and should be more like 1.5 C).
Therefore, in order to limit future temperature increase to an additional 1.0 C, the world will be allowed to emit no more than 500 gtons more carbon in all of the next decades and centuries. Note that when exactly future carbon is emitted does not matter. It is only our “cumulative” emissions that matters because the extra carbon we add to the biosphere lasts essentially forever on a time scale of relevance to human civilizations.
So, next focus on the three curves on the right side of the figure that represent three different scenarios for future emission. The blue curve shows one that would apply if the peak of carbon emissions was being achieved today. In that case note that over the next 100 years we could limit future emissions to 500 gtons (the area under this curve) by using the realistically doable annual reductions of about 6% per year shown in CO2 emissions. Yes, that scenario for future emissions is conceivable and doable. but unfortunately, we are not currently on that scenario. Instead, we are more likely on one of the other two scenarios shown in which peak emissions are envisioned to be either 15 or 25 years into the future. The 25-year scenario is shown to be virtually impossible to follow through on because after those 25 years of increasing emissions, we will have used up our allowed quota and all emissions would then have to stop immediately at that point in time in order to limit total future emissions to 500 gtons (the area under this curve). We can also see that even the 15-years-to-peak scenario would be very challenging to live with after that peak year because of the exceedingly sharp decreases also required after that peak year in order to limit total future emissions down to 500 gtons.
We don’t know what scenario we are on yet – that is, we don’t know yet when we will be able to stabilize emissions. What we learn from figure, however, is that the year of peak emissions had better be in the current decade or the amount of total carbon accumulated in the biosphere at the end of the current century will cause temperatures to increase beyond 2 degrees C and that result would be incompatible with present forms of civilization.
Thus, the problem posed by global warming is clearly an IMMEDIATE one that needs to be addressed today. Furthermore, it is clear that addressing it should be our very highest priority. If we are not successful in addressing this issue in the present decade, all others will become of little relative importance.
Point 6. Feedback effects and the unknowns and uncertainties
You might have noticed that when future temperature increases are predicted by comprehensive climate models, the range of expected temperatures is usually quite large. For example, in the figure below taken from a recent EPA document, the expected temperatures out to the year 2100 are shown under four different assumptions for future emissions. But note how large the uncertainty bars shown to the right side of the graph are for each calculation. For the red line showing the high future emissions case, the temperature in 2100 is expected to between about 3 and 5 degrees C higher than it was in 1900.

And in another recent study by Hansen, et al. (http://arxiv.org/abs/0804.1126), the temperature rise expected when the level of CO2 has doubled at some future date relative to its 1850 value of 280 ppm was predicted to be about 3 C if only “fast feedbacks” are included and about 6 C if “slow feedbacks” are also included. While all of these predictions are very alarming and some are absolutely horrendous, the question I’ll focus on here is – why is the range of predictions is so large and what are these “feedback effects” that appear to be so important.
Let’s start with just the effect of CO2 by itself. This prediction is easy to come up with because it can be made via basic principles of well-known physics. A doubling of CO2 would by itself cause the Earth to warm up by 1.2 C. The rest of the story concerns various “feedback” mechanisms all of which carry far greater levels of unknowns and uncertainties.
So what are these “feedbacks” that are put in motion by the modest temperature rise caused by CO2 itself? One of the most important of these is that a warmer world will cause more liquid and solid water to vaporize and the gaseous form of water that results is a very strong greenhouse gas. This temperature effect on water is called a “positive feedback” effect because it will amplify rather than diminish the original warming effect of CO2 by about three times – thus leading to a prediction of temperature increase of about 3 C.
However, increased water vapor will also cause an increase in cloud formation and these cloud changes could constitute both a positive and negative feedback. This additional positive feedback would be due to the fact that clouds intercept outgoing IR radiation just as the greenhouse gases do – thereby warming the Earth. The negative feedback of clouds is caused by their reflection (albedo) of incoming solar radiation – thereby cooling the Earth. While we suspect that these positive and negative feedback effects of clouds very roughly cancel each other out, we don’t really know enough about both of them as to assign precise numbers. Thus, a significant amount of our uncertainty in predictions is due our limited knowledge of clouds.
The above examples of feedbacks associated with water vapor and clouds are examples of “fast feedback” processes. That is, these feedbacks occur relatively quickly upon a temperature change. Another example of a fast and positive feedback is associated with the extent surface coverage by sea ice, such as that over the Arctic Ocean. When the Earth gets warmer the extent of sea coverage is decreased and that greatly changes the albedo (sunlight reflection) of that region. While sea ice will reflect up to 90% of the incoming sunlight that strikes it, an open ocean will reflect only about 10% – thereby warming that region of the globe. Therefore, the decease of sea ice caused by an increase in temperature sets up another strong positive fast-feedback effect. A similarly fast and positive feedback effect is caused by the extent of snow coverage over the entire planet. Bare and vegetated ground reflects much less sunlight than do snow and ice covered surfaces.
Another strong positive feedback effect would be caused by the warming of our permafrost regions of the Arctic. As these regions warm up, they will emit increasing amounts of carbon dioxide and methane (note that methane is also a very important greenhouse gas). While this might constitute a strong positive feedback effect, it is not typically included in climate models because we don’t know enough yet about its quantitative details. Once included, however, this addition to the models can only cause greater predicted warming.
And then there are also an assortment of “slow feedback” processes that would be expected to be of importance only after the passage of greater amounts of time, such as several decades, centuries, or even millennia. For example, one of these concerns the dynamics of our vast ice sheets covering Greenland and Antarctica. As these melt, changes in the Earth’s albedo applies just as it does for sea ice, but these changes in the ice sheets occur much more slowly. In addition, as these massive ice sheets melt, their height will decrease to altitudes where the atmosphere is warmer (note, for example, that the ice on the exceedingly cold Antarctic plateau is about 10,000 feet high). The science associated with ice sheet changes is in it infancy and, therefore, includes a great deal of uncertainty at this point.
Another slow feedback mechanism will involve the carbon cycle itself. Currently about half of our emitted CO2 is absorbed by plants and the oceans while the other half stays in the atmosphere. In a warmer world, however, we can expect that the uptake of CO2 by the warmer oceans will decrease and that the same will probably happen to total global vegetation. Thus, we can expect this feedback effect to leave more CO2 in the atmosphere thereby causing a slow positive feedback effect.
Finally, there is one more feedback that differs from all of the others in that it is one that we have any “control” over. This one is mankind, himself, and what he chooses to do in the future. If we continue to increase our emissions of CO2, mankind’s feedback effect will continue to be strong and positive – thereby making matters much worse. Mankind can put an end to this only by stopping all conversions of fossil fuels to CO2. Unfortunately, mankind has not yet figured out how it can change this to a negative feedback. The various schemes that have been considered to date for removing CO2 from the atmosphere have turned out to be far too expensive for implementation. Thus, it presently appears that all mankind can do is to cease being a positive feedback and, so far, we are a long way from doing that.
In summary, the initial warming caused by the additional CO2 mankind is emitting into the atmosphere is clear and well understood. It is the myriad of subsequent feedback effects that are not so well understood and these are the causes of the uncertainties involved. We should not take any comfort, however, in these uncertainties. This is because the sum of all the detrimental positive feedback effects involved are likely to cause greater positive feedbacks than those estimated based on current knowledge. For example, increased emissions by our warming permafrost regions could, all by itself, result in unstoppable, irreversible warming. All we can do to avoid that catastrophic event, as well as others of this type, is to prevent the initial warming by CO2.
