Yes, this is true as indicated in the figure below:
These are a serious of curves that follow the information provided by Kevin Anderson four posts ago. I have drawn them myself here in a manner that hopefully conveys his major point. That is, addressing AGW is really a short-term and immediate issue.
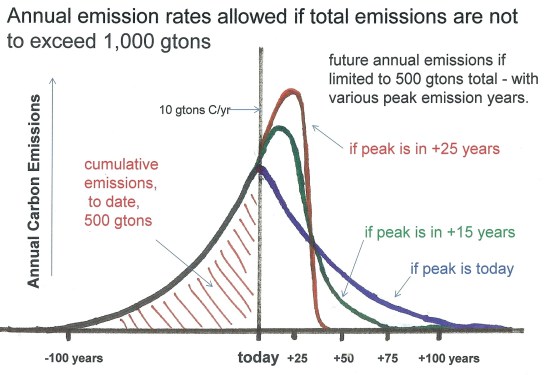
The point being made here follows on the heals of a previous Post called, “Its the Cumulative Emissions, Stupid!”. First note the known emission rates prior to TODAY shown by the black curve in the figure. The area under this curve, shown by red hash marks, represent the amount of Total Emissions from the beginning of the Industrial Period up to the present. We know that those total emissions were about 500 gtons of carbon (in the form of carbon dioxide). We also know that those emissions have and will cause about 1.0 degrees C of warming (of which about 0.8 C has already occurred). If we hope to limit total Industrial Age warming to a maximum of 2.0 C, it is widely thought that we must limit total emissions to about 1,000 gtons carbon. That is, we must not emit more than another 500 gtons C in the future. Because the excess CO2 stays in the atmosphere so long (several centuries), it does not matter when in the next century or two we emit that 500 gtons of additional carbon. This is simply the total we will be allowed to emit in the future if we want future warming to be less than 2 degrees C (3.6 degrees F)
Now what if we immediately stop our increase in emissions today and then decrease them continuously as shown by the blue line in the figure. With this plan we would have to drasctically reduce annual emissions as shown in the next 100 years. Because the blue line is the mirror image of the black line representing our known past emissions, the area under the blue line would also represent 500 gtons of carbon. Therefore, by this plan our objective of limiting total emissions over all time since the beginning of the Industrial Period would be achieved. This would not be easy, however. It would be very challenging to reduce annual emissions as shown by the blue line . Nevertheless, we will see also see that this would undoubtedly provided our easiest route if we want the reduce total warming to 2.0 C.
Next, let’s move on to consider future annual emissions as represented by the green curve. This one is more realistic in that it shows that annual emissions are still increasing exponentially today. That, indeed, is what is presently happening due a continuation of Business as Usual in the developed countries due to the increased globalization of world markets and especially that of China. A CO2 molecule emitted in China, of couse, has the same effect as one emitted anywhere – it is the Global Cumulative Emissions that count. For the green curve, I have assumed that annual emissions will finally peak and turn around in about +15 years from now. Then I completed the downward motion of the green curve so that the total area under the green line is again the same as that under the black curve – that is, a total area under the green curve that would again be equivalent to the allowed future cumulative emissions of 500 gtons. Note how much faster annual emissions would have to be cut following that peak year 15 years from now. Cutting annual emissions that much and that quickly would be even much more difficult than those shown by the blue curve.
Finally, let’s see what happens if we allow annual emissions to continue to increase for +25 more years as shown by the red curve. Note that the cut in annual emissions after that peak year would then have to be literally precipitous and immediate after that peak year just 25 years hence if, again, total future cumulative emissions were to be held to 500 gtoms carbon. That is, annual emissions of about 10 gtons per year would have to go to near zero within just a few years. That would, of course, be practically impossible and could not be done. In that case, we would undoubltedly have to admit that we can not hold future temperature increases to 2 degrees C. This admission is already occurring, in fact, because of the general consensus that we probably will not manage to reduce annual emissions in a manner shown by the blue or the green curves either. That is, we have perhaps already waited taoo long to limit our total emission to 1,000 gtons of carbon.
a
Nevertheless, the message of the figure we are discussing still applies. That is, if we change our goal to limiting future warming to 2.5 degrees C, for example, then our total allowed cumulative emissions would be about 1,250 gtons and our allowed future emissions would be 750 gtons instead of 500 gtons. In that case, it would still be advantageous to move the Peak Year forward in time as much as possible so that the required decrease in annual emission thereafter would be physically possible. How and whether existing civilizations could withstand a warming level of 2.5 degrees C would be a separate and good question that would also then have to be addressed.
Botttom Line: The Peak Year must be made As Soon As Possible and the closer it is to Today, the more feasible (or should I say possible) future required reductions in annual emissions will be. So yes, addressing AGW is our greatest short term challenge. We simply must begin to take forceful action on this problem right now and throughout this present decade.

Leave a comment