First, a definition of the word “strident”: it is “presenting a point of view, especially a controversial one, in an excessively and unpleasantly forceful way”. In discussing and writing about the global warming problem, I am sometimes accused of being too strident and exaggerating the dire nature of our present state. The more I learn about this problem, however, the more strident and concerned I get. In this post, I will share yet another reason why I am indeed exceedingly strident on this topic and believe that you should be too.
In point #5 under the “science basics” tab of this website, I previously explained why addressing the global warming problem should have mankind’s highest priority. In making that point, I illustrated the importance of when the “peak” of world-wide CO2 emissions will occur – with the help of the following Figure 1.
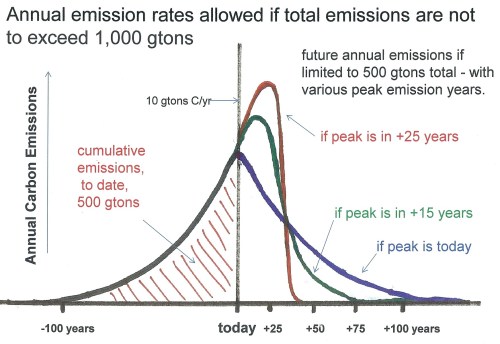
The CO2 emissions of the world since the beginning of the Industrial Age to Today are shown on the left side of this figure. Those total cumulative emissions are represented by the area under this curve, shown by the red hash marks. We also know that those previous carbon emissions were about 500 gtons (one gigaton is equal to one billion metric tons) of carbon and that they will increase the average surface temperatures of the Earth by about 1.0 degrees Centigrade (1.8 degrees F). The political leaders of the world have set a goal of limiting total surface average temperature increase to 2.0 C (note also that most scientists believe that this allowance is too high and should be more like 1.5 C).
Therefore, in order to limit future temperature increase to an additional 1.0 C, the world will be allowed to emit no more than 500 gtons more carbon in all of the next decades and centuries. Note that when, exactly, future carbon is emitted does not matter. It is only our “cumulative” emissions that matters because the extra carbon we add to the biosphere lasts essentially forever on a time scale of relevance to human civilizations.
Next, we previously focused on the three curves on the right side of the Figure 1 that represent three different scenarios for future emission. The blue curve shows one that would apply if the peak of carbon emissions was being achieved today. In that case note that over the next 100 years we could limit future emissions to 500 gtons (the area under this curve) by using the realistically doable annual reductions of about 6% per year shown in CO2 emissions. Yes, that scenario for future emissions is conceivable and doable. but unfortunately, we are not currently on that scenario. Instead, we are more likely on one of the other two scenarios shown in which peak emissions are envisioned to be either 15 or 25 years into the future. The 25-year scenario is shown to be virtually impossible to follow through on because after those 25 years of increasing emissions, we will have used up our allowed quota and all global emissions would then have to stop immediately at that point in time in order to limit total future emissions to 500 gtons (the area under this curve). We can also see that even the 15-years-to-peak scenario would be very challenging to live with after that peak year because of the sharp, but possibly doable decreases required after that peak year in order to limit total future emissions down to 500 gtons.
We don’t know what scenario we are on yet, but let’s assume for the moment that we are on the +15 year peak scenario and then add to it one more important point illustrated in Figure 2 below.
 In addressing the global warming problem, we must recognize that the countries of the world will have differing abilities of making necessary changes. The more developed and wealthy countries of the world will be in a much better position to install alternate means of energy production, such as wind mills, solar panels, and nuclear power plants, than the less developed and poorer countries. Therefore, in Figure 2 I have divided the total emissions shown in Figure 1 into two parts – one for the developed and one for the developing countries.
In the Past section of Figure 2, we see that the emissions of the developed counties (black curve) far exceeded those of the developing countries (red curve) and constituted the lion’s share of previous total global emissions. We also see in Figure 2 that those emissions of the developed countries have finally leveled off and are now expected to decrease in future years. During the last couple decades, however, the emissions of the developing countries, including China and India, have increased so rapidly that their total emissions are now approximately equal to those of the developed countries and do not yet show signs of decreasing or even leveling off. An optimistic view for the developing countries might be that their emissions will reach a peak in +15 years from Today and we will tentatively make that assumption here. As to their emissions after year 15, I have assumed in Figure 2 that they will be equal to the total global future emissions shown in Figure 1 after year 15.
Lastly, we can then see in Figure 2 the very small emission allowance that will be left for use by the developed countries in the future This portion of the black curve shows that the developed countries of the world must immediately begin a sharp decrease in their CO2 emissions by magnitudes that far exceed anything that is being discussed in the public domain today. As shown in this figure, our goal should be to reach near-zero emissions within the next 10 to 15 years. And recall that this is to limit future temperature increases to 2.0 C while an increase of only 1.5 C is recommended by ongoing scientific research.
Therefore, what we are doing today versus what we should be doing is as different as black and white and certainly merits an extremely strident expression of problem. The only reason for not adopting this strident view would be that one does not trust the prevailing view of the problem that modern climate science is currently providing. Yet the American public, their elected officials and even our institutions of higher learning do not seem to be well-aware of what I have described here. The most common response coming from them is to claim ignorance of these latest findings of science and to ignore them. Too many in the public domain also appear to have derived comfort from the erroneous claims of the fossil fuel industries that they are squarely addressing the problem and that all will be OK if they are allowed to remain in charge of our energy sector.
The last decade has shown that the clear and calm expressions of the issue provided by our very best scientists have not moved the public to the required levels of action. Therefore, what other styles of expression remain for scientists other than very strident ones? That is, “presenting a point of view, especially a controversial one, in an excessively and unpleasantly forceful way” now seems to be the most appropriate and possibly the only manner remaining when explaining the latest insights of science. Hopefully the membership of that choir will greatly increase ASAP so that their screams are heard over the soothing, “don’t worry, be happy” melody of our business-as-usual forces. The future of our descendants depends on it.

Leave a comment